

Doubling your conversion rate gets you the same result as doubling your ad spend, without the extra ad bill. Yet most teams keep paying for more traffic and leave the landing page alone.
Below are the fixes in the order we’d make them, plus a way to test changes when you don’t have enough traffic for proper A/B tests.
The maths: conversion rate beats traffic volume
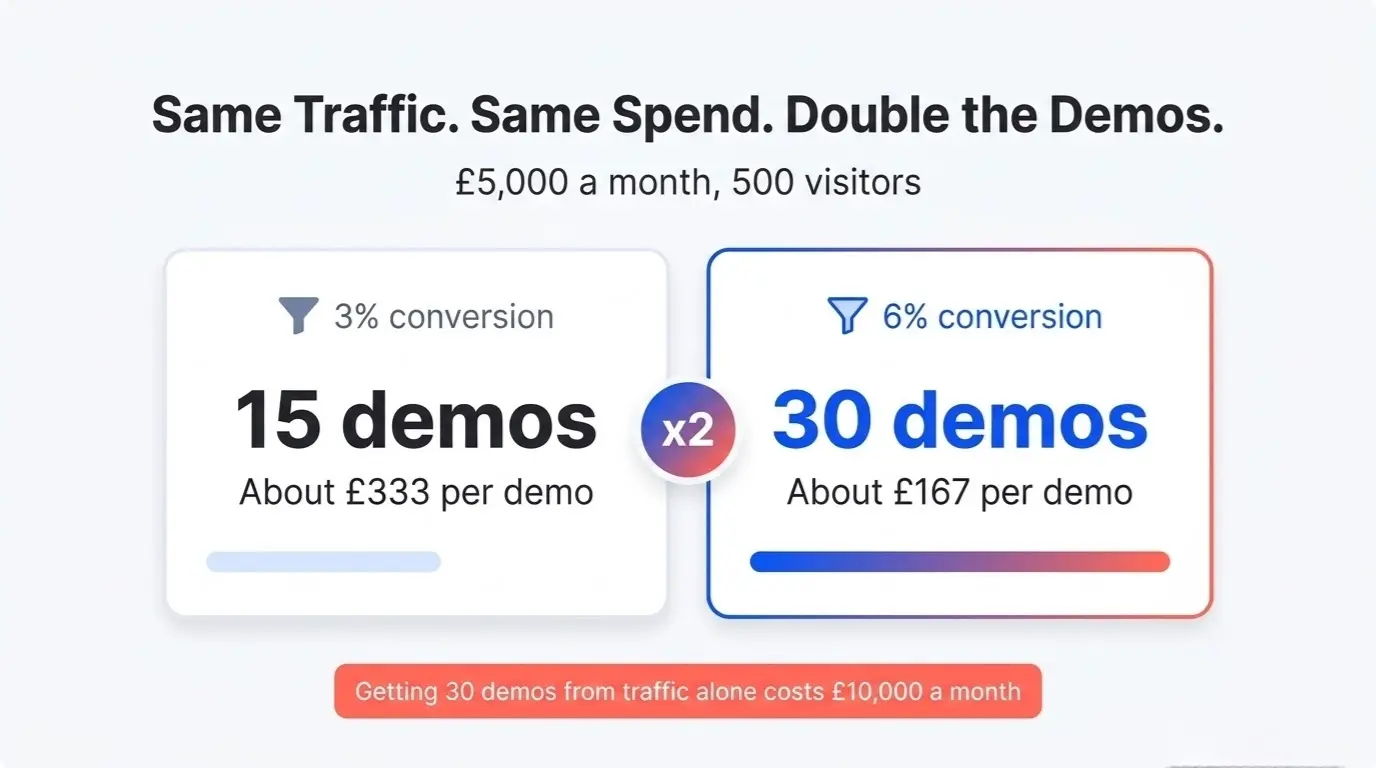
Say you spend £5,000 a month on ads and send 500 visitors to a landing page. At a 3% conversion rate, that’s 15 demo requests, or about £333 per demo.
At 6%, the same visitors and the same spend give you 30 demos, about £167 each. Getting to 30 demos by buying more traffic means spending £10,000 a month. If you’re still deciding where that budget should go, our comparison of LinkedIn Ads vs Google Ads for B2B SaaS will help.
Once you have steady traffic, fixing the page is usually the cheapest way to get more demos, so do that before you scale spend.
Key Insight: A page that converts twice as well halves your cost per demo on paid traffic and doubles the demos from organic and email traffic too.
Message match: the most common reason pages fail
The ad promises one thing, the page talks about another, and the visitor leaves.
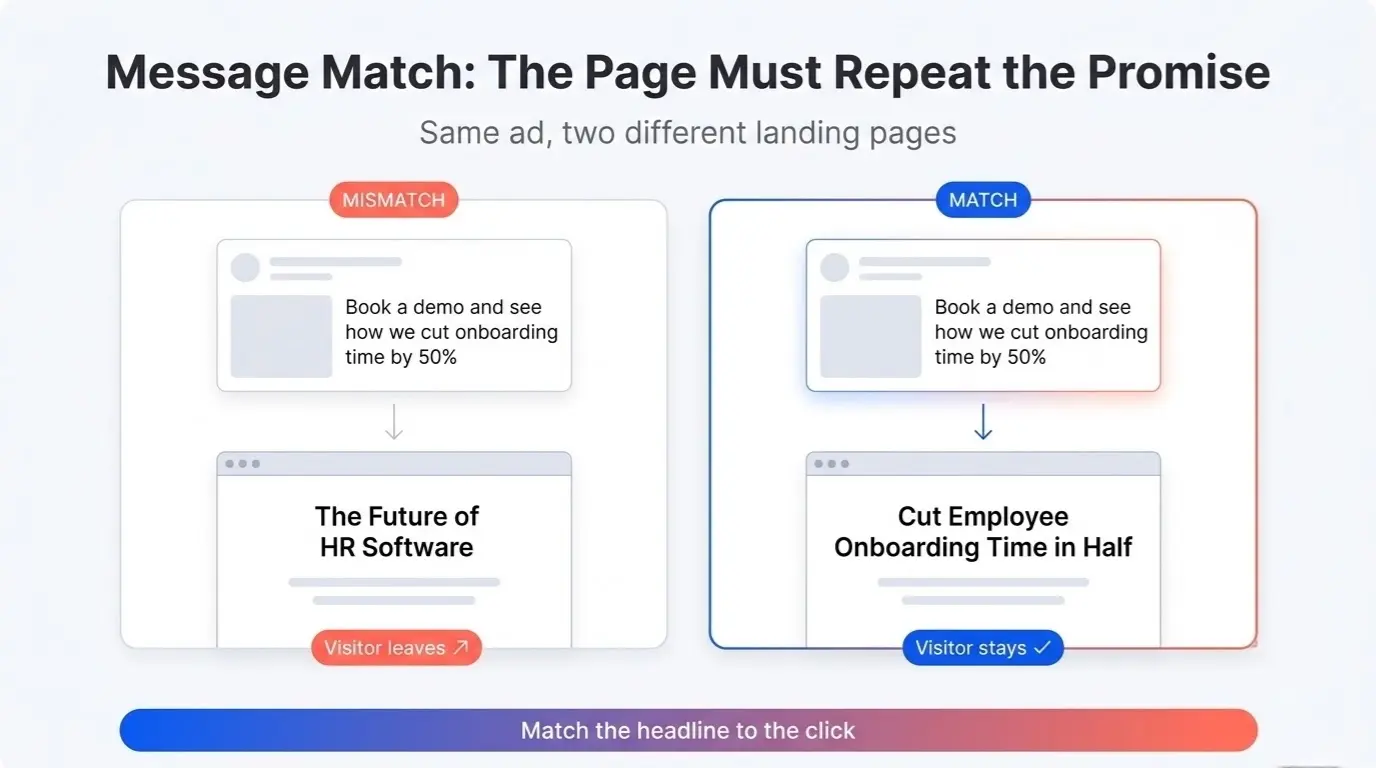
Say your LinkedIn ad reads “Book a demo and see how we cut onboarding time by 50%.” The visitor clicks and lands on a page headlined “The Future of HR Software.” Nothing on screen tells them they’re in the right place, so they go back.
The fix is to repeat the ad’s promise in the headline: “Cut Employee Onboarding Time in Half.”
Apply the same rule to every traffic source. A visitor from a blog post about security should see security first. A visitor from a pricing comparison should see pricing. A visitor arriving from a comparison page should land on something that continues the comparison. The same goes for SEO content built to drive MQLs: the next page has to pick up where the article stopped.
What a B2B SaaS landing page needs
Most SaaS landing pages carry more than they need. These seven elements do the work:
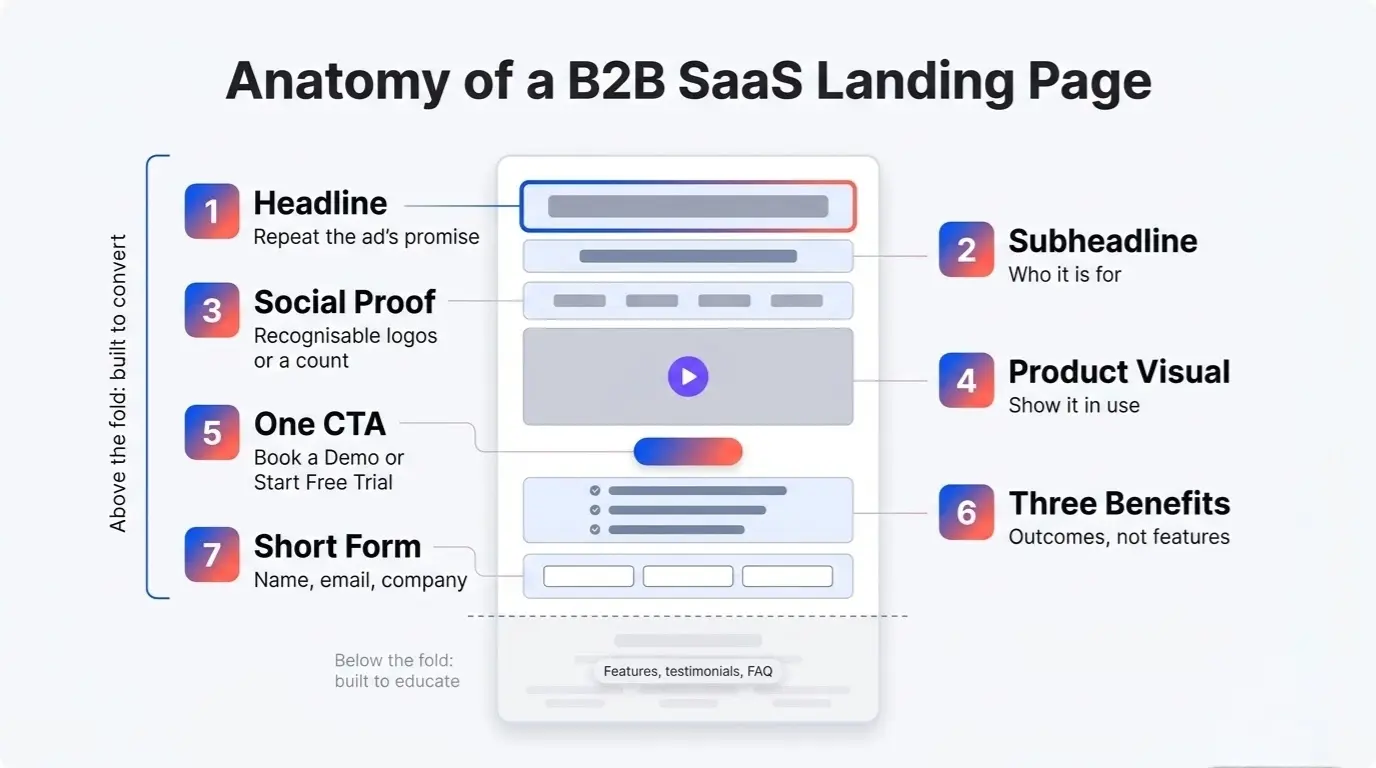
- Headline. One sentence that repeats the promise from the ad or link the visitor clicked. Specific and benefit-led.
- Subheadline. One sentence that says who the product is for or what they’ll get.
- Social proof above the fold. Logos of customers people recognise, or a line such as “Used by 2,000+ companies in Southeast Asia.”
- Product visual. Show the product in use, not a stock photo. A short demo video usually explains more than a static screenshot, so test one.
- One CTA. “Book a Demo” or “Start Free Trial.” Pick one. A second CTA splits attention.
- Three benefit bullets. What changes after they use the product. Outcomes, not features: “Save 10 hours a week on reporting” beats “Automated dashboards.”
- A short form. Name, email and company.
Put feature detail, longer testimonials and FAQs below the fold. The top of the page is there to convert, and the rest can educate. Page speed matters at the top too: a slow page loses visitors before any of this loads, and our technical SEO checklist covers the fixes.
Choose the CTA that fits your sales motion
The wrong CTA for your sales motion costs conversions. As a rule of thumb:
- Start Free Trial fits a self-serve product that costs under £500 a month and needs no custom setup. Buyers want to try it themselves.
- Book a Demo fits deals above £1,000 a month, complex implementations, or several stakeholders. Buyers expect to see the product before they commit.
- Talk to Sales and Contact Us belong on large enterprise deals. Elsewhere they feel like high-pressure sales, while “Book a Demo” tells the visitor what happens next.
Between £500 and £1,000 a month, either can work. Test both.
Trust signals for buyers in Southeast Asia
If you sell in Singapore, Malaysia, the Philippines or Indonesia, local proof carries more weight than global brand names.
- Local customer logos. A buyer in Kuala Lumpur wants to see Malaysian companies next to the US names.
- Local currency pricing. Show prices in SGD, MYR, PHP or IDR. Don’t make visitors convert dollars in their head.
- Regional case studies. A case study from a Singapore fintech is more credible to a Singapore buyer than a generic US example.
Our guide to content marketing for B2B SaaS in Southeast Asia covers how to build local case studies and pricing pages market by market. A complete Google Business Profile with reviews adds to that credibility, and we cover it in local SEO for B2B in Singapore and Malaysia.
Audit your form
The form is the last step before a demo request, and each extra field gives the visitor another reason to quit. Check yours against this list:
- Count the fields. Name, email and company are enough to start a conversation.
- Remove the phone number. Many buyers won’t give one out for fear of spam calls.
- Make company size, industry and role optional, or drop them. You can ask in the follow-up email or on the call.
- Replace “Submit” with button text that says what happens next, such as “Book a Demo.”
Key Insight: Add a field only if the answer changes what happens next. If sales does the same thing whatever the visitor writes, drop it.
There’s no universal figure for what each field costs you, so measure it on your own page. One extra field can earn its place: “How did you hear about us?” as free text. The answers show influence that click tracking misses, and our guide to measuring marketing ROI with a long sales cycle explains how to use them. If you’re worried about drop-off, test it as an optional field first.
Test changes when you don’t have much traffic
A page with a few hundred to a couple of thousand visitors a month can’t run a clean A/B test quickly. At 500 visitors and a 3% conversion rate you get about 15 demos a month, and random variation alone can move that number by three or four in either direction. Reaching statistical significance can take months, and by then your offer may have changed.
Use sequential testing instead:
- Make one change, such as cutting the form from seven fields to three.
- Run it for two weeks and compare the conversion rate to the previous two weeks.
- Keep the change if conversion improved. Revert it if not, then test something else.
This method has limits. A before-and-after comparison can’t separate your change from a shift in traffic mix or seasonality, so check that your traffic sources looked similar in both periods and treat small differences as noise.
Pair it with qualitative tools. Session recordings in a tool like Hotjar show where visitors hesitate, an exit-intent survey asks why they’re leaving, and five people testing the page will surface confusion your analytics can’t.
Where to start
Start with message match. List your three biggest traffic sources, such as ads, blog posts and email campaigns, and check that the landing page headline repeats the promise in each link.
Then cut the form to three fields and compare two weeks before and after. Both changes are cheap, and you’ll have an answer within a month.
If you’d like a second opinion on your landing pages, request a free audit or book a discovery call and we’ll tell you what to fix first.